To kick off this blog I had to do something with my favorite team, the Angels. My friends and family would say I am obsessed but I will say passionate is the better word. Missed only one home opener the last 15+ years and going to 20+ games every year while having to follow every moment either at the ballpark, on TV, radio, Twitter, or the MLB AtBat app. Just love baseball and supporting the Angels, even though it has been a struggle recently. The 2021 Angels season was all about witnessing the historic season by AL MVP winner Shohei Ohtani. He dominated on both the mound and in the batter’s box. I have never witnessed one player do all that he did, and we all just expected greatness whenever he was on the field. For part 1 I focus on an aspect of Shohei the batter, and in part 2 the pitcher.
Shohei was fantastic in the batter’s box slugging 46 home runs, 152 wRC+, and 0.964 OPS. However, in the second half of the season he struggled, especially in August. In the second half his SLG went down over 200 points, but he actually increased his OBP with the high number of walks he received. This was a product of how pitchers were attacking him, a little impatience with no protection, and pulling the baseball more. Going from Mike Trout to Phil Gosselin (Goose!) hitting behind you is quite drastic. Pitchers were attacking Shohei very differently in the first and second half, which is what I wanted to explore. In addition, the distribution of pitches for swing and misses versus hits, and pull percentage were different as well. Let’s see how different it was.
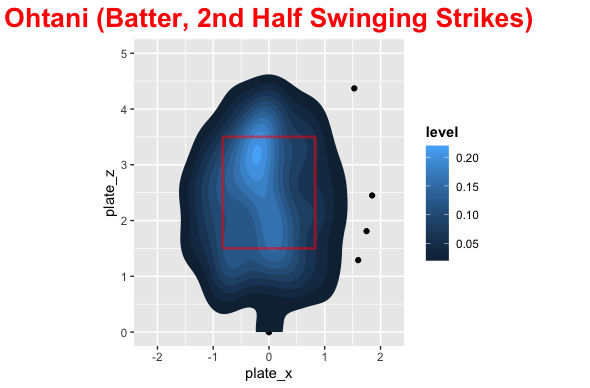
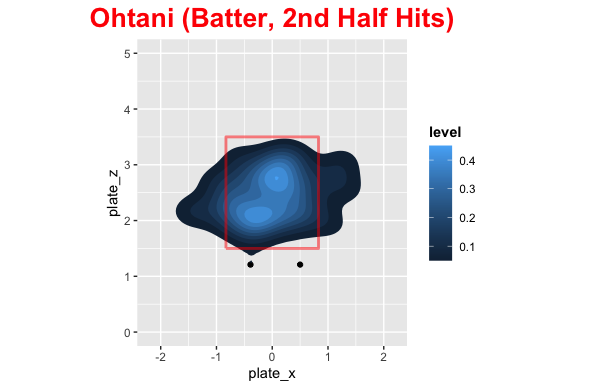
NOTE: To visualize pitch locations, I will be using a heatmap that will show the magnitude of the number of pitches in each location. In simple terms, the lighter the blue the more pitches were in that area. The strike zone is in red, and the view is from the catcher’s perspective.
First Half
| Pull % | Center % | Opposite % |
| 43.1% | 31.9% | 25% |


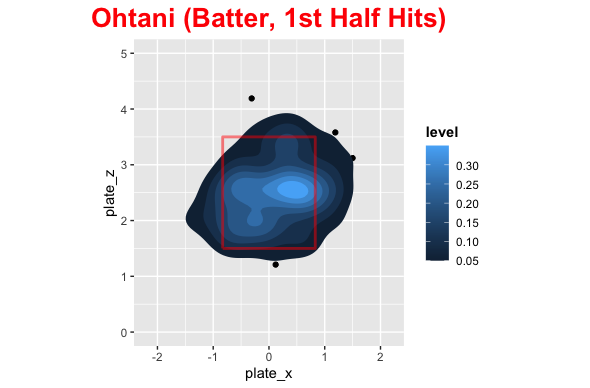
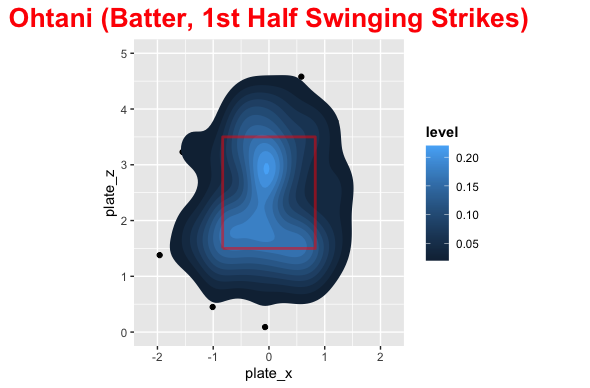
In the first half of the season the distribution of pitch locations was fairly uniform around the strike zone with most pitches being middle down in the zone. This is probably biased with being ahead of the count. Shohei’s swinging strikes were concentrated middle up and down and outside. He dominated at about belt level across the plate with most of his damage on the inside part of the plate. The distribution of where he hit the baseball was pretty spread out with center + opposite field being higher than pull.
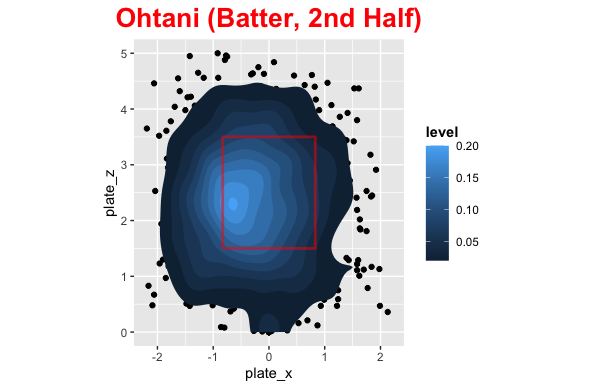
Second Half
| Pull % | Center % | Opposite % |
| 54.8% | 27.4% | 17.8% |


In the second half pitchers attacked Shohei on the outside part of the plate with pitchers going way down and in more than the first half. His swing and misses were up and outside as well as down and in. The hits were middle up a little and down and outside, due to how he was pitched. Shohei became much more of a pull hitter in the second half as well and pitchers were exploiting this.
Comparison
Here are some images that make it easy to compare the 1st and 2nd half for Shohei.


Conclusion
Ok so the distribution of pitches was quite different in the first and second half, so what? Well, we can clearly see that pitchers exploited the pull mentality by pitching him outside more and without protection they could try below the strike zone to get him to chase. For 2022 with Trout behind him (Or even Rendon), pitchers cannot do what they did in the second half and Shohei can be patient. He will need to get back to being less of a pull hitter, which probably stemmed from frustration not getting pitches to hit, but he is set up to perform more like his first half offensive numbers next season with protection behind him.
