For as good as Shohei Ohtani is at the plate, his ability on the mound is arguably his best tool. His devastating splitter strikes fear in hitters around the league. Oh yeah, he also can hit 100 MPH on his fastball. He gets 100 MPH exit velocity off the bat and can throw 100 MPH, truly amazing. With the Angels letting Shohei hit for himself in games that he pitched in 2021, this led to a roll of the dice depending on how deep into the game he pitched. It made sense since he is a better hitter than anyone else that they could put in the DH spot but if he did not pitch deep into the game the Angels could possibly run out of position players to hit in the pitcher’s spot. When everything worked it was fantastic, but when it didn’t it was difficult. The key for Shohei pitching deep into games was his command. When his strike-to-ball ratio was bad, he could not pitch deep into games. To explore this I will use a technique I saw years ago in a Sloan Conference Research paper: “Bullpen Strategies For Major League Baseball” (https://www.sloansportsconference.com/research-papers/bullpen-strategies-for-major-league-baseball) by Harrison Willie and John Salmon. They use the strike-to-ball ratio to figure out when to pull a pitcher, but I will just be using their plotting technique plus regression to assess control for Shohei. Thought the technique used was a great way to visualize how well a pitcher is doing, specifically with command. Now let’s analyze Shohei.
Command
I took pitch level data from BaseballSavant for this analysis. Unfortunately, they do not have a variable tracking the number of strikes, balls, or total pitches for a pitcher so I just engineered the variables myself. I plotted the data where the number of strikes were on the y-axis and the number of balls on the x-axis. I built a linear regression (line solid black and formula below) to find Shohei’s average strike-to-ball ratio. In simple terms, games where Shohei is above this line are good and below are bad. Games along or close to that line was average for him.
Strikes = 4.07 + 1.56*Balls
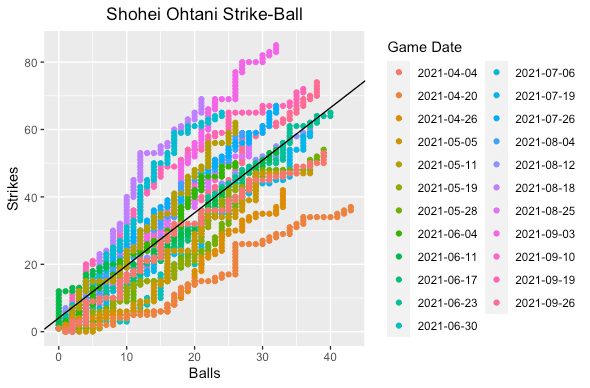

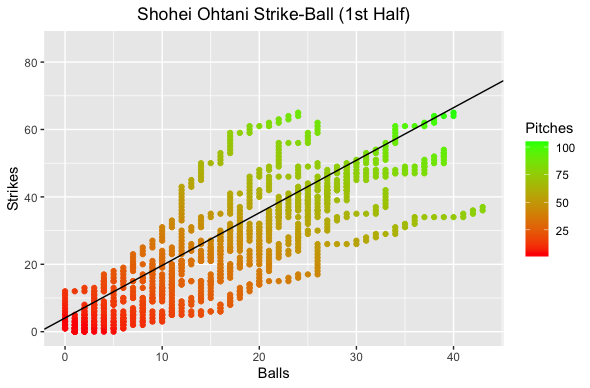
The plot on the left shows Shohei’s strike-to-ball ratio on the game level while the right color codes the number of pitches Shohei threw. What I noticed right away on the game level was that most of the games he was above average occurred in the second half of the season. This is no surprise, as anyone who watched Shohei (including myself) noticed he struggled mightily with command to start the season. On the pitch level we can see that for games that were above average he generally got to a higher pitch count. Let’s compare the first and second halves of the season.

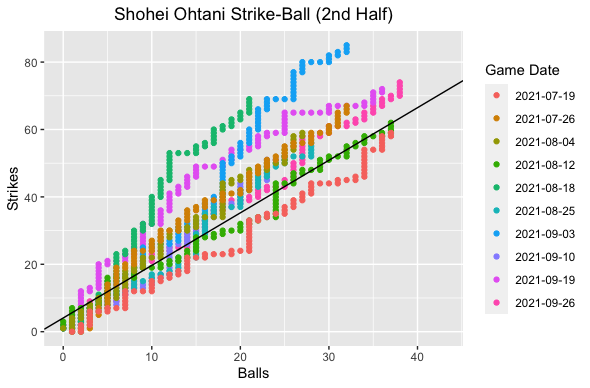
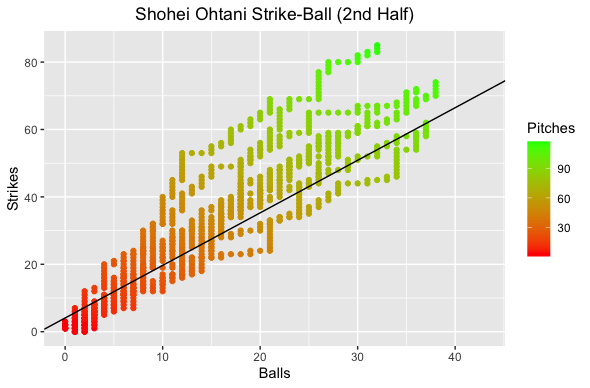
Now we can clearly see the differences in the first and second halves of the season. Clearly in the second half he had a much better strike-to-ball ratio in more games. So, we have established that Shohei had better command as the season progressed, but what changed? Although pitching was always my favorite position, I am not qualified to be a pitching coach nor am I in sports science. Thus, I cannot comment on the pitching mechanics changes Shohei implemented over the course of the season. BaseballSavant does have release positions, velocities, and accelerations but did not to go this route. Maybe a future blog post. I decided to look at something I noticed watching him pitch, fastball (four-seam + two-seam) velocity and splitter velocity.
Fastball
The first thing I did was look at Shohei’s average fastball velocity by inning in the first and second halves of the season.
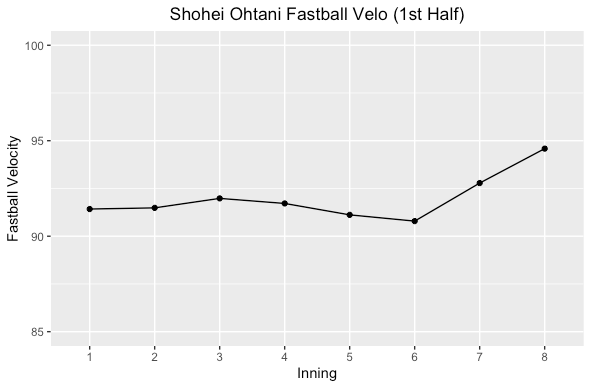
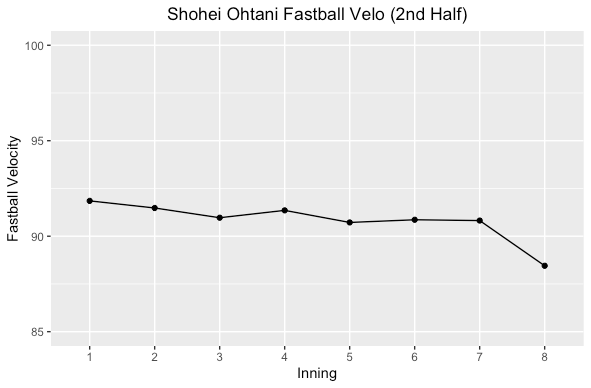
Shohei had a slightly lower fastball velocity over the course of a game in the second half of the season but not a huge difference. He kept up a fairly consistent velocity, but in the first half of the season in the 7th and 8th he increased velocity while it declined in the second half. Could have been by design for better command but he was doing so much every day, so fatigue was probably a factor. Not much difference though, but let’s look at his splitter.
Splitter
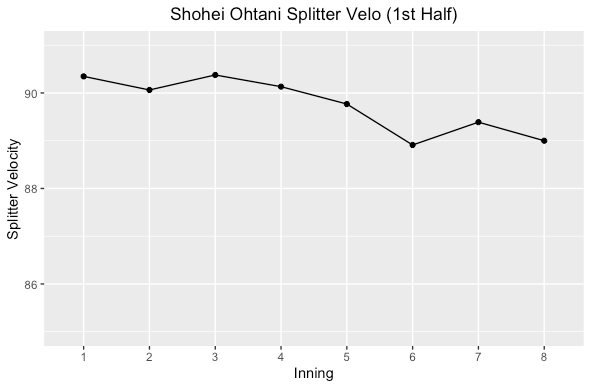
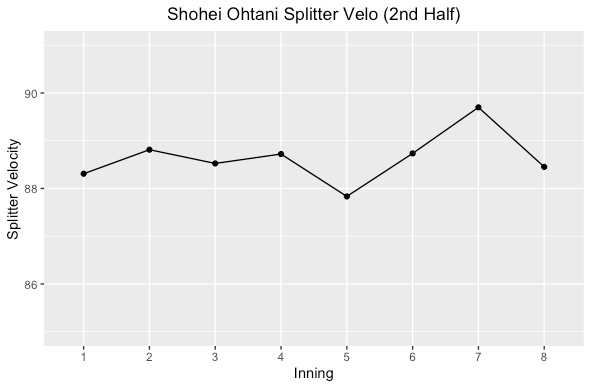
This is where things get really interesting. In the first half Shohei’s average splitter velocity started above 90 MPH and decreased as the game went on. The second half of the season he started at a lower velocity and increased it after the 5th inning, but not getting to 90 MPH on average. Was it for command? Could be, or by design the lower velocity helps make his fastball better with a larger differential (average fastball minus splitter velocity).
Fastball & Splitter Velocity Differential
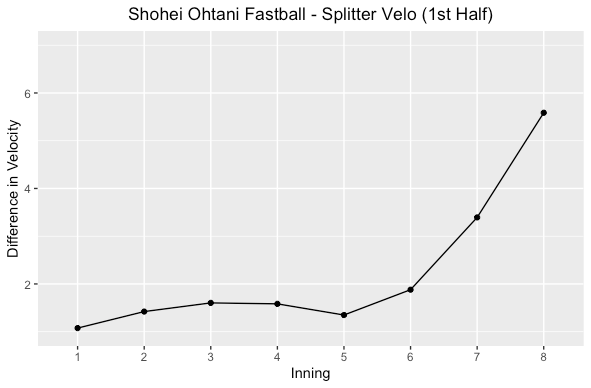
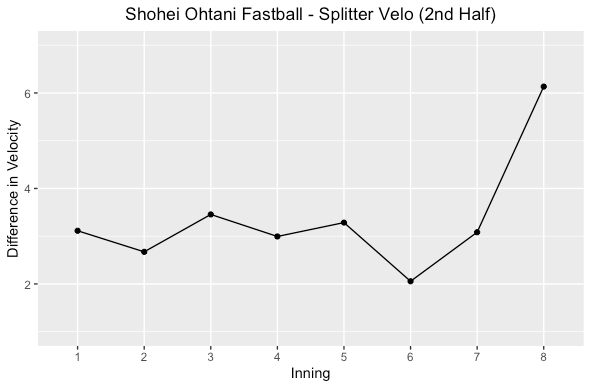
In the first half of the season Shohei had a low differential in fastball and splitter velocity on average. Both halves showed increased differential later in the game. The more differential, the more effective at getting swing and misses he is. More swing and misses mean more strikes and finishing off hitters earlier in the at bat. Watching him in the first half, he didn’t really get a lot of swing and misses on his splitter but in the second half he got more.
Conclusion
We can conclude that Shohei’s change in fastball and splitter velocity led to better command in the second half, right? Not quite, need more statistical analysis to make that claim. Correlation never means causation and there could be many other factors that influenced this like mechanics changes, pitching to contact, better command of the slider, use of the cutter, or other things. Whatever it may have been, Shohei showed better command in the second half and thought this was an interesting observation. Truly lucky to witness his historic season in 2021 and excited to see what he does in 2022!
