My favorite machine learning algorithms are unsupervised clustering. I think there is elegance in finding patterns in data that we don’t know about. Clustering is grouping similar data together in a data set when the groupings are unknown. This is based on how far away data points are from other groups and how close they are to other data points in their group. In layman’s terms, you are like your group but different from other groups. As an example, let’s think about cats and dogs. There are many different types of dogs, but they are all similar because they are all dogs. Same for cats, many types but all cats. However, cats are different than dogs, thus are different animals. There are many more technical insights into clustering, but this is the idea. Once we get clusters, since groupings are unknown, we use a domain expert to determine what these groups represent.
I may be wrong because I’ve never worked in a front office, but I believe clustering is underutilized in the baseball industry. It is such a powerful tool that can lead to many discoveries. From a team perspective, we can identify undervalued players that are like superstars in the game and at a cheaper price. From an agency perspective, we also identify undervalued players to target, as well as potential superstars at the high school, college, and minor league level. Of course, with any machine learning algorithm, it’s never a guarantee but it can glean insights that we may not be aware of. There are many questions as to which variables to use, from what time period our data comes from, and many other data questions that need to be taken into consideration but I will keep it simple.
Methodology
For this analysis I took starting pitchers that had 100+ innings pitched in 2021, which resulted in 115 starting pitchers. Each variable used in clustering adds a dimension to the data. For example, if we have three variables then the data lives in three dimensions. Obviously for four or higher we cannot visualize the data but also the data gets further apart, thus not as good clusters. I decided on three metrics: WAR, Swinging Strike %, and Barrel %. It is up for debate if these are the best to use and there very well could be a better combination, but I decided on these because they exemplify a pitcher’s value, swing and miss ability, and how well they limit hard contact.
The clustering technique I will be utilizing is called k-means. This algorithm clusters the data into k groups. The difficulty with this algorithm is that we must choose a k value to run it. So how do we choose k? Well sometimes it is chosen with domain knowledge if the number of groups is known already and other times we use a metric to determine the best k value. In this case I will be utilizing a mix of domain knowledge and a metric. The metric I will use is called a silhouette score, where a value closer to 1 indicates better clustering. A silhouette score considers how close data is to their own cluster (cohesion) and how far away they are from other clusters (separation). For k from 2-10 I will calculate the silhouette score, and I will repeat this 10 times and average them to avoid variation caused by randomness. When clustering, we always scale the data because the algorithm is distance based.
We have all the tools, let’s cluster!
Clustering
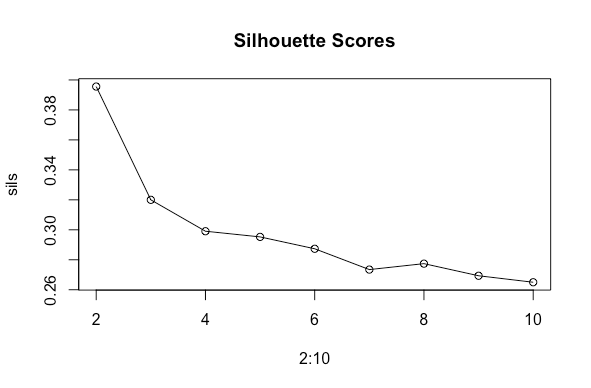
From the silhouette scores, the best option is two clusters with a value of 0.396. However, there are more than two types of pitchers in the league so I will go with three, which had a value of 0.32. Neither of these scores are great, as they are far from 1, but real data is never like in textbooks. Here are the averages of the metrics per cluster.
| Cluster | WAR | Swinging Strike % | Barrel % |
| 1 | 3.67 | 0.131 | 0.068 |
| 2 | 0.989 | 0.101 | 0.094 |
| 3 | 2.19 | 0.099 | 0.077 |
Results
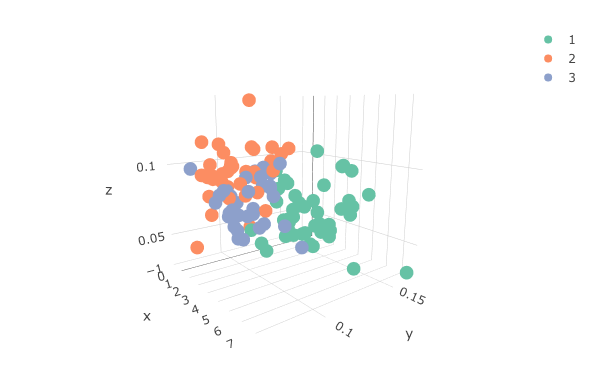
Since we have only three variables, we can visualize the data in a 3D plot and see the separation of clusters.
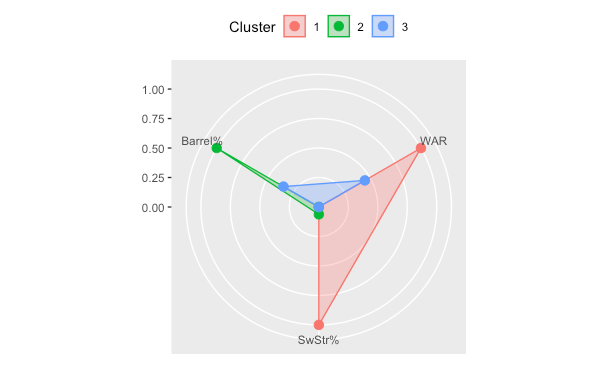
Another neat way of visualizing the groups and analyzing them is a radar plot. It shows what variables are the largest signals for each group.

Cluster 1
Cluster 1 (in red) is the group of elite pitchers. They have a high WAR and Swinging Strike % while limiting hard contact with a low Barrel %. Here are the pitchers in Cluster 1.
| Name | WAR | Swinging Strike % | Barrel % | Cluster |
| Carlos Rodon | 4.9 | 0.15 | 0.066 | 1 |
| Corbin Burnes | 7.5 | 0.166 | 0.031 | 1 |
| Max Scherzer | 5.4 | 0.159 | 0.08 | 1 |
| Walker Buehler | 5.5 | 0.116 | 0.068 | 1 |
| Brandon Woodruff | 4.7 | 0.129 | 0.058 | 1 |
| Trevor Rogers | 4.2 | 0.141 | 0.05 | 1 |
| Lance Lynn | 4.2 | 0.12 | 0.057 | 1 |
| Zack Wheeler | 7.3 | 0.124 | 0.046 | 1 |
| Kevin Gausman | 4.8 | 0.153 | 0.071 | 1 |
| Robbie Ray | 3.9 | 0.155 | 0.098 | 1 |
| Freddy Peralta | 3.9 | 0.144 | 0.057 | 1 |
| Marcus Stroman | 3.4 | 0.116 | 0.065 | 1 |
| Logan Webb | 4 | 0.124 | 0.056 | 1 |
| Pablo Lopez | 2.3 | 0.118 | 0.074 | 1 |
| Lance McCullers Jr. | 3.3 | 0.116 | 0.053 | 1 |
| Shohei Ohtani | 3 | 0.129 | 0.071 | 1 |
| Sandy Alcantara | 4.2 | 0.133 | 0.061 | 1 |
| Alek Manoah | 2 | 0.126 | 0.058 | 1 |
| Gerrit Cole | 5.3 | 0.145 | 0.098 | 1 |
| Joe Musgrove | 3.2 | 0.127 | 0.074 | 1 |
| Charlie Morton | 4.6 | 0.124 | 0.049 | 1 |
| Frankie Montas | 4.1 | 0.137 | 0.087 | 1 |
| Shane McClanahan | 2.5 | 0.148 | 0.107 | 1 |
| Kyle Gibson | 3.1 | 0.104 | 0.045 | 1 |
| Lucas Giolito | 4 | 0.153 | 0.067 | 1 |
| Clayton Kershaw | 3.4 | 0.167 | 0.069 | 1 |
| Luis Garcia | 3.1 | 0.132 | 0.07 | 1 |
| Tyler Mahle | 3.8 | 0.114 | 0.065 | 1 |
| Nathan Eovaldi | 5.6 | 0.126 | 0.063 | 1 |
| Alex Wood | 2.5 | 0.125 | 0.053 | 1 |
| Jordan Montgomery | 3.3 | 0.137 | 0.074 | 1 |
| Dylan Cease | 4.4 | 0.148 | 0.099 | 1 |
| Sean Manaea | 3.3 | 0.123 | 0.08 | 1 |
| Luis Castillo | 3.7 | 0.131 | 0.045 | 1 |
| Sonny Gray | 2.4 | 0.106 | 0.047 | 1 |
| Yu Darvish | 2.9 | 0.121 | 0.088 | 1 |
| Jameson Taillon | 2 | 0.122 | 0.082 | 1 |
| German Marquez | 3.4 | 0.121 | 0.053 | 1 |
| Aaron Nola | 4.5 | 0.128 | 0.071 | 1 |
| Kenta Maeda | 1.7 | 0.136 | 0.063 | 1 |
| Logan Gilbert | 2.2 | 0.125 | 0.088 | 1 |
| Eduardo Rodriguez | 3.8 | 0.117 | 0.068 | 1 |
| Brady Singer | 2 | 0.102 | 0.056 | 1 |
| JT Brubaker | 0.3 | 0.12 | 0.088 | 1 |
| Andrew Heaney | 1.2 | 0.127 | 0.093 | 1 |
We see the top starting pitchers like NL CY Young award winner Corbin Burnes, AL CY Young award winner Robbie Ray, Max Scherzer, Kevin Gausman, Shohei Othani, and others. Some up-and-coming talent like Alex Manoah, Logan Webb, and Logan Gilbert are also a part of this group. There are many interesting names in this group, but a couple of names stand out here as surprising are JT Brubaker and Andrew Heaney. These players are not known as elite yet are in this group. Does this mean they will be elite? Not necessarily, but the metrics indicate they could be. This is a big reason why the Yankees last season and Dodgers this season took a chance on Heaney. They have the tools to be elite but could be a steal for a team.
Cluster 2
Cluster 2 (in green) are the underachievers with low WAR and Swinging Strike % and allow a lot of hard contact with a high barrel %. Here are the pitchers in Cluster 2.
| Name | WAR | Swinging Strike % | Barrel % | Cluster |
| Trevor Bauer | 1.8 | 0.126 | 0.106 | 2 |
| Framber Valdez | 1.9 | 0.102 | 0.058 | 2 |
| Adrian Houser | 1.5 | 0.07 | 0.05 | 2 |
| Ian Anderson | 1.9 | 0.119 | 0.095 | 2 |
| Casey Mize | 1.3 | 0.094 | 0.1 | 2 |
| Rich Hill | 1.6 | 0.098 | 0.088 | 2 |
| James Kaprielian | 1.3 | 0.11 | 0.094 | 2 |
| Marco Gonzales | 0.6 | 0.091 | 0.114 | 2 |
| Joe Ross | 1.3 | 0.111 | 0.09 | 2 |
| Blake Snell | 2.1 | 0.129 | 0.11 | 2 |
| Zac Gallen | 1.5 | 0.091 | 0.079 | 2 |
| Jake Odorizzi | 1 | 0.094 | 0.096 | 2 |
| Tarik Skubal | 0.8 | 0.111 | 0.143 | 2 |
| Yusei Kikuchi | 1.1 | 0.125 | 0.11 | 2 |
| Taijuan Walker | 1.2 | 0.095 | 0.102 | 2 |
| Austin Gomber | 1.3 | 0.113 | 0.094 | 2 |
| Dane Dunning | 1.8 | 0.1 | 0.08 | 2 |
| Nick Pivetta | 2.1 | 0.106 | 0.082 | 2 |
| Jon Gray | 2.3 | 0.11 | 0.069 | 2 |
| Jon Lester | 0 | 0.087 | 0.077 | 2 |
| Vladimir Gutierrez | 0.6 | 0.096 | 0.084 | 2 |
| Drew Smyly | 0.2 | 0.118 | 0.108 | 2 |
| Martin Perez | 0.5 | 0.08 | 0.094 | 2 |
| Kris Bubic | -0.1 | 0.089 | 0.099 | 2 |
| Triston McKenzie | 1.1 | 0.124 | 0.1 | 2 |
| Adbert Alzolay | 0.4 | 0.115 | 0.11 | 2 |
| Dallas Keuchel | 0.7 | 0.086 | 0.091 | 2 |
| Garrett Richards | 0.4 | 0.094 | 0.093 | 2 |
| Erick Fedde | 1.1 | 0.089 | 0.09 | 2 |
| Brad Keller | 1.1 | 0.091 | 0.109 | 2 |
| Jordan Lyles | -0.2 | 0.105 | 0.096 | 2 |
| Wil Crowe | -0.3 | 0.105 | 0.095 | 2 |
| Zach Davies | 0.1 | 0.09 | 0.091 | 2 |
| J.A. Happ | 0.5 | 0.081 | 0.116 | 2 |
| Patrick Corbin | 0.2 | 0.112 | 0.092 | 2 |
| Mitch Keller | 1.1 | 0.082 | 0.068 | 2 |
| Jorge Lopez | 0.8 | 0.082 | 0.093 | 2 |
We see some names that aren’t surprising like Dane Dunning, Drew Smyly, Wil Crowe, and others. Also, there are pitchers who took a step back like Yusei Kikuchi, Jake Odorizzi, and Blake Snell. Several surprises in here but a couple that stand out are Martin Perez and Trevor Bauer. Martin Perez got a long-term deal with the Tigers but was in this group. Bauer’s WAR was affected not playing the entire season but his Barrel % was high, which contributed to him being in this group.
Cluster 3
Cluster 3 (in blue) are the average performers for the season. Not the best but not the worst WAR, Swinging Strike %, and Barrel %. Here are the pitchers in Cluster 3.
| Name | WAR | Swinging Strike % | Barrel % | Cluster |
| Julio Urias | 5 | 0.112 | 0.053 | 3 |
| Eric Lauer | 1.8 | 0.105 | 0.07 | 3 |
| Max Fried | 3.8 | 0.111 | 0.063 | 3 |
| Adam Wainwright | 3.8 | 0.081 | 0.062 | 3 |
| Cal Quantrill | 1.8 | 0.089 | 0.07 | 3 |
| Chris Bassitt | 3.3 | 0.101 | 0.065 | 3 |
| Anthony DeSclafani | 3 | 0.11 | 0.081 | 3 |
| Wade Miley | 2.9 | 0.101 | 0.061 | 3 |
| Jose Berrios | 4.1 | 0.099 | 0.091 | 3 |
| Chris Flexen | 3 | 0.086 | 0.063 | 3 |
| Jose Urquidy | 1.8 | 0.118 | 0.093 | 3 |
| John Means | 2.5 | 0.119 | 0.101 | 3 |
| Michael Pineda | 1.3 | 0.104 | 0.091 | 3 |
| Steven Matz | 2.8 | 0.094 | 0.07 | 3 |
| Aaron Civale | 0.8 | 0.094 | 0.082 | 3 |
| Johnny Cueto | 1.5 | 0.097 | 0.066 | 3 |
| Zack Greinke | 1.4 | 0.091 | 0.066 | 3 |
| Zach Eflin | 2.2 | 0.102 | 0.068 | 3 |
| Cole Irvin | 2.1 | 0.089 | 0.073 | 3 |
| Kyle Freeland | 1.5 | 0.085 | 0.082 | 3 |
| Hyun-Jin Ryu | 2.5 | 0.097 | 0.085 | 3 |
| Antonio Senzatela | 3.5 | 0.086 | 0.059 | 3 |
| Merrill Kelly | 2.4 | 0.088 | 0.063 | 3 |
| Tyler Anderson | 2.1 | 0.115 | 0.085 | 3 |
| Michael Wacha | 1.5 | 0.115 | 0.097 | 3 |
| Zach Plesac | 1.1 | 0.112 | 0.094 | 3 |
| Madison Bumgarner | 1.5 | 0.096 | 0.075 | 3 |
| Kyle Hendricks | 1.3 | 0.089 | 0.084 | 3 |
| Mike Minor | 2.3 | 0.107 | 0.093 | 3 |
| Chris Paddack | 1.8 | 0.112 | 0.085 | 3 |
| Ryan Yarbrough | 0.9 | 0.096 | 0.078 | 3 |
| Mike Foltynewicz | -0.8 | 0.08 | 0.096 | 3 |
| Matt Harvey | 1.9 | 0.08 | 0.079 | 3 |
There are some players that make sense like Johnny Cueto, Zack Grienke, and Hyun-Jin Ryu. A few surprises in here like Matt Harvey and Julio Urias for different reason. We’d expect Harvey in Cluster 2 while Urias would have been expected in Cluster 1.
Conclusion
We can clearly see differences in groups and identified players that are undervalued and even possibly overvalued. There could very well be a better combination of metrics to use and even could employ other clustering techniques. The beauty of machine learning is that there is always another way to do something that could be an improvement, and the fun part is finding it. Clustering is not perfect, and we saw with the silhouette scores that it definitely wasn’t perfect in this case, but clustering is still very useful to group players to see what insights there could be.
