New Hawkeye technology is allowing us to measure bat speed for hitters and the data has now become available through Baseball Savant. The idea of exit velocity is related to the change in velocity (i.e. Pitch speed to exit velocity), where it should be dependent on pitch speed, launch angle (how good the contact is), and bat speed. For those physics fanatics, it is related to momentum (P = mv). So, do we have everything we need to predict exit velocity perfectly? Let’s dive in!
I selected data from just August of contact (no foul balls) because we have enough data for a model (13,301 observations) from Baseball Savant.
First, let’s look at correlation between exit velocity and the predictive variables
| Variable 1 | Variable 2 | Correlation |
| Exit Velocity | Pitch Speed | 0.108 |
| Exit Velocity | Launch Angle | 0.149 |
| Exit Velocity | Bat Speed | 0.468 |
We see a positive correlation for each, meaning there is a positive trend between exit velocity and the other variables. These are weak correlations, with bat speed being the most decent correlation.
Next, we will model exit velocity (Exit_Velo ~ Pitch_Speed + Launch_Angle + Bat_Speed)
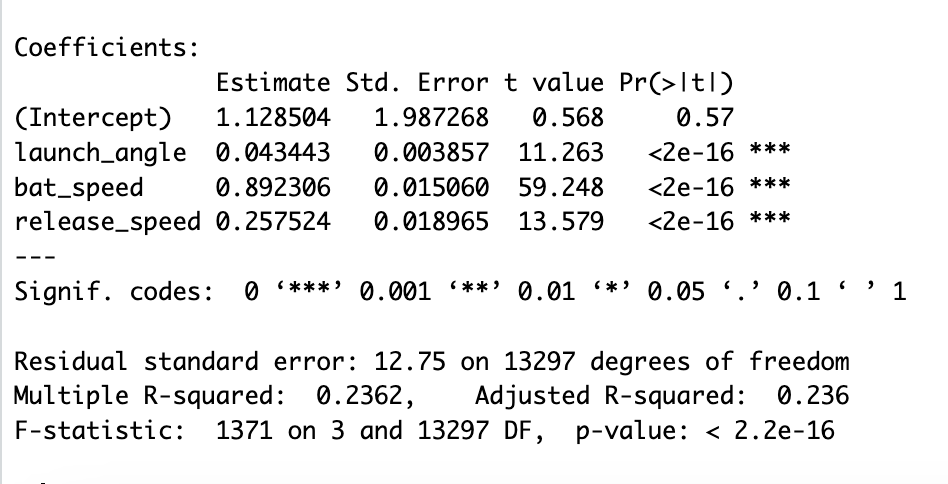
Note: release_speed = pitch_speed
With a logistic regression model, we get a model that explains 23.6% of variability in the data, with bat speed having the largest effect size. All variables are significant, but with a large data set this is expected. Let’s call it how it is, this model is not good, which is very interesting. Would more data fix this? Maybe, but the sample size is large. What other variables could be impacting exit velocity? Maybe weather? From a physics perspective, we have a majority of what we have (except air friction from weather) so this is a surprising result to me at least.
Being the physicist lover that I am, let’s build a change in momentum statistic (Exit Velocity minus Pitch Speed).
| player_name | bat_speed | momentum_change | |
| 1 | Cabbage, Trey | 78.91372 | 20.2 |
| 2 | Narvaez, Carlos | 75.11731 | 17.1 |
| 3 | Baker, Luken | 74.89069 | 16.2 |
| 4 | Crawford, Brandon | 79.51338 | 15.6 |
| 5 | Monasterio, Andruw | 70.5919433 | 12.85 |
| 6 | Haase, Eric | 71.3540129 | 10.1714286 |
| 7 | Sweeney, Trey | 76.348464 | 10.1 |
| 8 | Riley, Austin | 75.0177657 | 8.12727273 |
| 9 | Cameron, Daz | 70.8280327 | 8.01818182 |
| 10 | Gonzalez, Romy | 73.5086556 | 7.71111111 |
And compare to highest bat speed.
| player_name | bat_speed | |
| 1 | Stanton, Giancarlo | 81.1253164 |
| 2 | Walker, Jordan | 80.2783138 |
| 3 | Crawford, Brandon | 79.51338 |
| 4 | Cabbage, Trey | 78.91372 |
| 5 | Wallner, Matt | 78.3187904 |
| 6 | Wisdom, Patrick | 77.8608838 |
| 7 | Leon, Pedro | 77.70978 |
| 8 | Judge, Aaron | 77.4944854 |
| 9 | Schwarber, Kyle | 77.3780231 |
| 10 | Adell, Jo | 77.1606417 |
Looking at these lists, those with the top 10 change in momentum that are on the top 10 list for bat speed are the following: Trey Cabbage, and Brandon Crawford (only 20%!!).
The old adage is that a pitcher that throws fast “provides the power”, which may be the reason for these results. Or, in general pitchers throwing faster means there is less of a difference in momentum here. There is more to learn with bat speed being available, and as more metrics become available it is exciting. Also, shout out to Jo Adell for being top 10 in bat speed in this data set!
