For years Taylor Ward had been up and down from the major league level and could not gain consistency. Ward then turned himself from an average major leaguer last season (turning it on in the second half) into an above average major leaguer. Before the 2022 season his career bWAR was -0.4 and he is already at 2.3 bWAR this season. Absolutely incredible jump and, if healthy, will be an All Star. Let’s dive into some stats!
Statistics
| Year | Barrel % | Avg Exit Velo | Launch Angle | wOBA | OPS+ | BB % | Chase % | Whiff % |
| 2021 | 10.3% | 89.6 MPH | 16.4° | 0.333 | 108 | 8.4% | 25.1% | 25.1% |
| 2022 | 18.4% | 89.5 MPH | 13.2° | 0.500 | 212 | 17.6% | 16.6% | 21.8% |
Overall, his number have drastically improved, as seen by the wOBA and OPS+. He isn’t hitting the ball much harder, but his lower launch angle is resulting in better contact. In addition, he improved his chase % by nearly 9%. Clearly his approach at the plate is better and a mechanical adjustment was made.
So his overall metrics have gotten better but now I want to dive deeper into his at bats.
At Bats
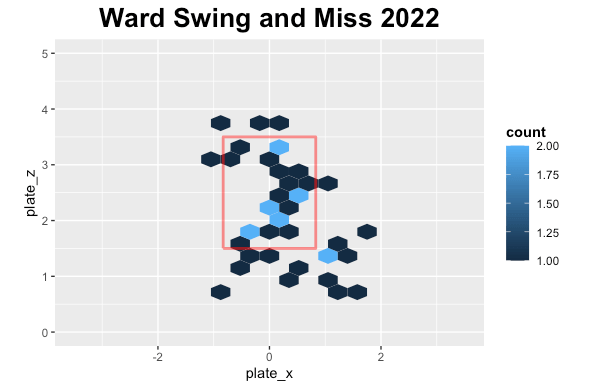
First, let’s look at his swing and misses.
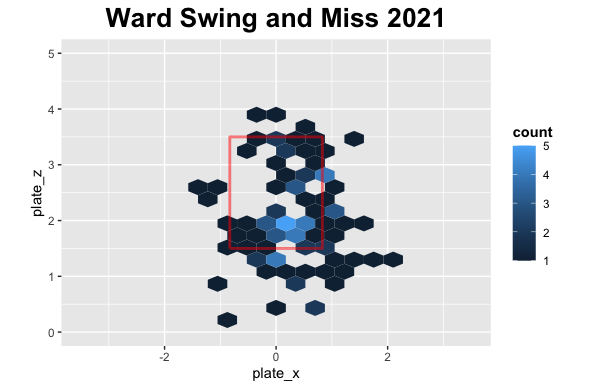
It is early in the season, so we don’t have as much data as last season but in 2021 there were a lot of swing and miss low while this season similar story but more around the plate.
Let’s look at the counts he has swung in.
Count Analysis
Ward 2021 Swings
| Count | Frequency | Percentage |
| 0-0 | 76 | 18.5% |
| 2-2 | 60 | 14.6% |
| 0-1 | 51 | 12.4% |
| 1-1 | 42 | 10.2% |
| 1-0 | 36 | 8.8% |
| 0-2 | 34 | 8.3% |
| 1-2 | 32 | 7.8% |
| 3-2 | 28 | 6.8% |
| 2-1 | 25 | 6.1% |
| 3-1 | 13 | 3.2% |
| 2-0 | 12 | 2.9% |
| 3-0 | 2 | 0.5% |
Ward 2022 Swings
| Count | Frequency | Percentage |
| 0-0 | 34 | 16.2% |
| 1-1 | 34 | 16.2% |
| 2-2 | 28 | 13.3% |
| 1-0 | 22 | 10.5% |
| 3-2 | 19 | 9.0% |
| 0-1 | 16 | 7.6% |
| 1-2 | 16 | 7.6% |
| 0-2 | 15 | 7.1% |
| 2-1 | 14 | 6.7% |
| 2-0 | 8 | 3.8% |
| 3-1 | 3 | 1.4% |
| 3-0 | 1 | 0.5% |
Ward is continuing to swing a lot at the first pitch in 2022 and there isn’t really a huge discernable difference from 2021. He has been quoted that the count doesn’t matter and his approach changed in an article from The Athletic: Ward Article
“The count … it doesn’t matter,” Ward said. “Just waiting for the ball to show up in the spot. That’s all that matters. No count. No lineup. It doesn’t matter. I’m just in the box, doing my thing. Don’t think about it at all.”
From Sam Blum, The Athletic
Now I will look at his hits in different counts.
Ward 2021 Hits
| Count | Frequency | Percentage |
| 0-0 | 15 | 28.8% |
| 0-1 | 6 | 11.5% |
| 1-1 | 6 | 11.5% |
| 1-0 | 5 | 9.6% |
| 1-2 | 5 | 9.6% |
| 0-2 | 4 | 7.7% |
| 2-2 | 4 | 7.7% |
| 3-2 | 4 | 7.7% |
| 2-0 | 2 | 3.8% |
| 3-1 | 1 | 1.9% |
Ward 2022 Hits
| Count | Frequency | Percentage |
| 1-1 | 9 | 22.5% |
| 3-2 | 6 | 15.0% |
| 0-1 | 5 | 12.5% |
| 2-2 | 5 | 12.5% |
| 0-0 | 4 | 10.0% |
| 1-2 | 3 | 7.5% |
| 0-2 | 2 | 5.0% |
| 1-0 | 2 | 5.0% |
| 2-0 | 2 | 5.0% |
| 3-1 | 2 | 5.0% |
In 2021 the majority of his hits were on the first pitch while in 2022 they are spread out, seemingly from his new approach.
Lastly, I wanted to look at the type of contact he is making and where the ball is going.
Contact Type Analysis
Ward Contact 2021
| Contact Type | Frequency | Percentage |
| Ground Ball | 60 | 38.5% |
| Fly Ball | 46 | 29.5% |
| Line Drive | 43 | 27.6% |
| Pop Up | 7 | 4.5% |
Ward Contact 2022
| Contact Type | Frequency | Percentage |
| Ground Ball | 30 | 35.7% |
| Fly Ball | 27 | 32.1% |
| Line Drive | 23 | 27.4% |
| Pop Up | 4 | 4.8% |
Ward Directional Statistics
| Year | Pull % | Center % | Opposite Field % |
| 2021 | 39.1% | 29.5% | 31.4% |
| 2022 | 45.4% | 30.9% | 23.7% |
Ward is putting the baseball in the air a tiny bit more and his ground ball percentage is a little less so far this season. We do see a major shift to pulling the baseball more and hitting it less to the opposite field, which is resulting in his higher power numbers.
Conclusion
Taylor Ward has improved drastically in all offensive categories. His approach at the plate has had a huge impact on his output this season. Analytics only tells you what is happening and what needs to be fixed, but it is up to the player to do it. We are seeing someone successfully changing his approach and becoming an all-star caliber player. Hopefully he can stay healthy and carry these numbers through the rest of the season.

Another fantastic and insightful piece of writing.
LikeLike